
IWILDT 武汉艾崴科技有限公司
Copyright Wuhan Ai Wei Technology Co., Ltd. All Rights Reserver.
A deep-learning-based framework for identifying and localizing multiple abnormalities and assessing cardiomegaly in chest X-ray
Nature Communications volume 15, Article number: 1347 (2024) Cite this article
1126 Accesses
4 Altmetric
Accurate identification and localization of multiple abnormalities are crucial steps in the interpretation of chest X-rays (CXRs); however, the lack of a large CXR dataset with bounding boxes severely constrains accurate localization research based on deep learning. We created a large CXR dataset named CXR-AL14, containing 165,988 CXRs and 253,844 bounding boxes. On the basis of this dataset, a deep-learning-based framework was developed to identify and localize 14 common abnormalities and calculate the cardiothoracic ratio (CTR) simultaneously. The mean average precision values obtained by the model for 14 abnormalities reached 0.572-0.631 with an intersection-over-union threshold of 0.5, and the intraclass correlation coefficient of the CTR algorithm exceeded 0.95 on the held-out, multicentre and prospective test datasets. This framework shows an excellent performance, good generalization ability and strong clinical applicability, which is superior to senior radiologists and suitable for routine clinical settings.


Chest X-ray (CXR) technology has become the initial imaging examination method for chest abnormalities because of its low cost and simple operating procedure1. The large number of CXRs generated worldwide are interpreted individually by radiologists, which requires considerable time and effort and increases the missed diagnosis and misdiagnosis rates2. The accurate automatic identification and localization of abnormalities in CXRs can effectively reduce the workload of radiologists and improve their diagnostic efficiency.
Previous studies have confirmed that deep learning can help radiologists efficiently interpret CXRs3. A deep learning-based classification model was developed to screen abnormal CXRs in a previous study;4 however, it would be more useful for radiologists if abnormalities in CXRs could be automatically identified. A disease-specific deep model was developed to detect certain chest diseases, such as nodules5,6, tuberculosis7, pneumothorax8 or pneumonia9. However, it may not ultimately be beneficial to the clinician’s interpretation because several coexisting abnormalities are commonly visible on CXR in actual clinical practice. Several studies10,11 have developed deep classification models for multiple abnormalities using public CXR datasets, but these models only provide classification results for each CXR without any localization information. A few studies12,13 have tried to localize abnormalities with the heatmaps generated by deep classification models. Nonetheless, heatmaps were only used to show which parts of a given CXR led the model to its final classification decision, so they could not strictly predict the standard bounding box of each abnormality14. In fact, to professionally realize the identification and localization of multiple abnormalities in CXRs, it is necessary to employ an object detection network from the field of computer vision based on a large CXR dataset with category and localization labels (bounding boxes) for each abnormality. Yongwon’s study15 developed an eDense You Only Look Once (YOLO) model for five CXR abnormalities with only 4,634 lesion masks, but its purpose was only to evaluate the reproducibility of the model. Nguyen16 created a small CXR dataset called VinDr-CXR, and two studies17,18 developed models based on this dataset to localize multiple lesions; however, it is difficult to achieve high localization performance due to the extremely limited number of bounding boxes. Notably, the lack of a large dataset with ground-truth (GT) bounding boxes significantly hampers the ability to accurately identify and localize multiple abnormalities in CXRs14.
In addition, the size of the heart shadow should also be observed by radiologists in a CXR. The cardiothoracic ratio (CTR) is often used to assess the degree of cardiomegaly in clinical practice;19 however, its manual calculation is relatively time-consuming.
In this work, we constructed a large CXR dataset named CXR-AL14 with bounding boxes for 14 abnormalities. Based on the CXR-AL14 dataset, a deep learning-based framework was developed for the identification and localization of 14 abnormalities and the simultaneous calculation of the CTR (Fig. 1). Finally, an intelligent diagnosis system was developed according to this framework to assist radiologists in more efficiently interpreting CXRs.
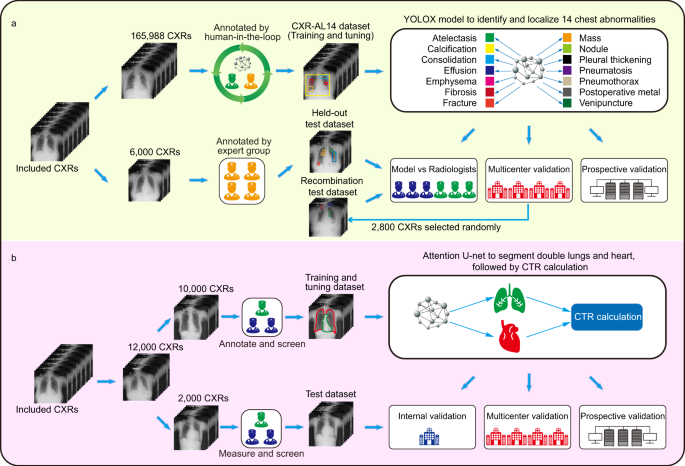
a Development and validation of the YOLOX model for the identification and localization of 14 chest abnormalities. b Development and validation of an algorithm for calculating the CTR to quantitatively assess cardiomegaly. CTR: cardiothoracic ratio.
The creation of the CXR-AL14 dataset was a very large project. After the screening process of the original CXRs (Supplementary Figure 1), the CXR-AL14 dataset was finally constructed with the help of a human-in-the-loop approach. To ensure the accuracy of annotation, we formulated annotation principles for each abnormality, and the annotation of each CXR was corrected by at least one senior radiologist and one expert radiologist (see Methods). The general information and detailed distribution of all abnormalities in the CXR-AL14 dataset can be seen in Table 1. Except for the atelectasis (358 GT bounding boxes), the number of GT bounding boxes for the other 13 abnormalities were all larger than 2,998. The abnormality with the largest number of GT bounding boxes was nodules, up to 45,977. To the best of our knowledge, the CXR-AL14 dataset is the largest CXR dataset with bounding boxes for 14 common abnormalities. Based on the dataset, the YOLOX model was trained and tuned for the identification and localization of multiple abnormalities at a ratio of 9:1, and evaluated on held-out, multicentre and prospective test datasets. Manufacturer and device information for each dataset is displayed in Supplementary Table 1.
The interreader and intrareader variability based on six experts’ annotations were assessed in this study. It is well known that the larger the intersection over union (IoU) value is, the higher the overlap rate between two bounding boxes and the better their consistency20. The assessment shows that the average intrareader IoU value of each abnormality ranged from 0.773 to 0.992, and the average interreader IoU value of each abnormality ranged from 0.698 to 0.968. More detailed information can be found in Supplementary Table 2. In addition, we found that IoU=0 for a few abnormalities. This occurred in two situations. One was that certain abnormalities were annotated by one expert but not by another expert, and the other was that certain abnormalities were annotated differently by two experts. We further counted the number of bounding boxes with IoU=0 for each abnormality and found that the maximal number was 14 in the interreader study (<0.023 per CXR) and the maximal number was 6 in the intrareader study (<0.01 per CXR). Detailed information can be found in Supplementary Table 3. These results demonstrated the good interreader and intrareader agreement of annotations.
The performance achieved by the updated deep model after each iteration was separately evaluated on the held-out test dataset, as shown in Fig. 2. The results demonstrated that as the number of iterations increased, the number of annotated CXRs also increased, and the performance of the updated model gradually improved. Note that the model with 0 iterations corresponds to the preliminary model. After seven iterations, the construction of the CXR-AL14 dataset was completed, and the updated model after the seventh iteration was the YOLOX model in the proposed framework, which achieved the highest performance. The results also demonstrated that the human-in-the-loop approach was effective for the annotation of the training dataset.
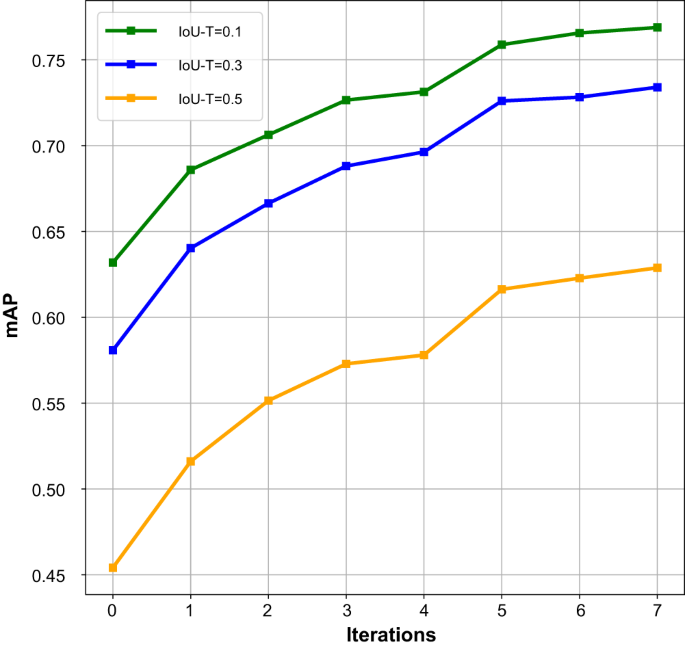
mAP: mean average precision, IoU-T: intersection over union threshold. (Source data are provided as a Source Data file.).
Five-fold cross-validation was performed on the CXR-AL14 dataset, and five models were generated. The performance results of the five models in the 5-fold cross-validation with an IoU-T of 0.5 are given in Supplementary Fig. 2, and the mean average precision (mAP) values of the five models were 0.591, 0.620, 0.626, 0.616 and 0.610, respectively. Moreover, the five models were further tested on the held-out test dataset, the corresponding results with an IoU-T of 0.5 are illustrated in Supplementary Fig. 3, and the corresponding mAPs were 0.599, 0.612, 0.619, 0.608 and 0.605, respectively. From these results, it was clear that all five models trained on the CXR-AL14 dataset had similar performance, suggesting that the performance of the model trained on the CXR-AL14 dataset would possess good stability and repeatability.
The preliminary validation of the performance of the YOLOX model was performed on the held-out test dataset, which was independent of the CXR-AL14 dataset (general information shown in Supplementary Table 4). When the IoU threshold (IoU-T) was set to 0.5, 0.3 and 0.1, the mAP values of 14 abnormalities achieved by the YOLOX model reached 0.629, 0.734 and 0.769, respectively. Except for that of atelectasis, the AP values of the other 13 abnormalities were all greater than 0.348 with three IoU-Ts. Note that the AP value of venipuncture was the highest and was higher than 0.9 with three IoU-Ts (Fig. 3). The PR curve of each abnormality obtained by the YOLOX model with different IoU-Ts can be found in Supplementary Fig. 4. Three examples interpreted by the YOLOX model for the identification and localization of multiple abnormalities and their corresponding GT bounding boxes are shown in Fig. 4.
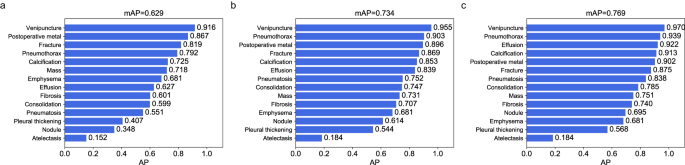
a AP values of 14 abnormalities with an IoU-T of 0.5, b AP values of 14 abnormalities with an IoU-T of 0.3, c AP values of 14 abnormalities with an IoU-T of 0.1. AP: average precision, IoU-T: intersection over union threshold. (Source data are provided as a Source Data file.).
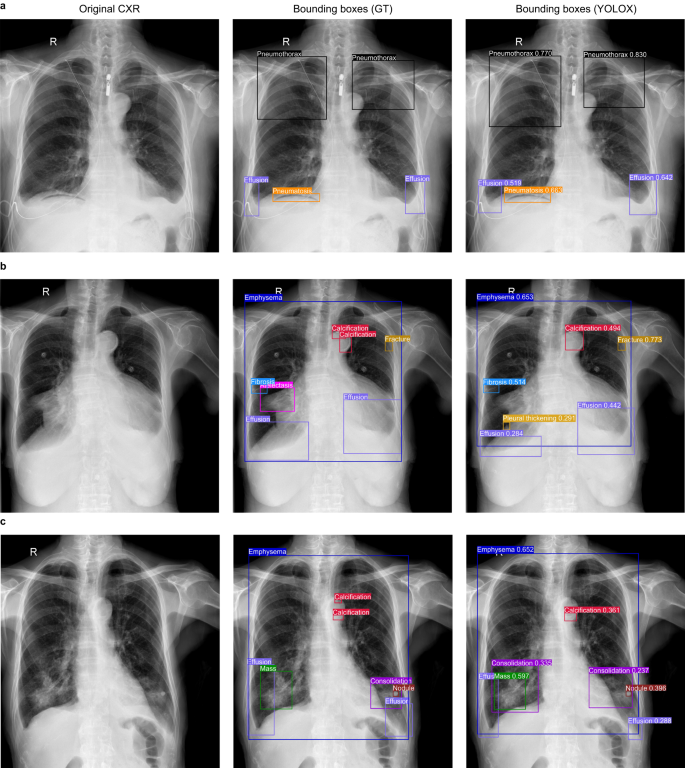
a In the case A, the category and localization of bounding boxes predicted by the YOLOX model were highly coincided with the GT bounding boxes; b In the case B, the YOLOX model missed atelectasis in the right lung hilar region and merged two separate calcifications on the aortic arch into a single calcification; c In the case C, The YOLOX model missed microcalcifications on the aortic arch and additionally diagnosed consolidation around the right lung mass. However, the other bounding boxes predicted by YOLOX model in case B and C were also highly coincided with the GT bounding boxes. GT: ground-truth.
In addition, when the IoU-T was set to 0.5, 0.3 and 0.1, the mAPs of the Faster R-CNN model were 0.271, 0.423, and 0.508, respectively, while the mAPs of the RetinaNet model were 0.506, 0.632, and 0.678, respectively. More details about the AP of each abnormality determined by the two models are shown in Supplementary Table 5. The performance of the YOLOX model was also compared with that of the Faster R-CNN model and the RetinaNet model, as shown in Supplementary Fig. 5. We can easily find that the performance of the YOLOX model was superior to that of the other two models.
To test the generalizability and robustness of the YOLOX model, another four completely independent external validation datasets were collected from primary hospitals in districts or counties (general information shown in Supplementary Table 4). When the IoU-T was set to 0.5, the YOLOX model achieved excellent performance in terms of the identification and localization of 14 abnormalities on four multicentre test datasets, and the mAP values were 0.586, 0.580, 0.605 and 0.572 (Supplementary Fig. 6). When the IoU-T was set to 0.3 or 0.1, the mAP of each external dataset also increased (Supplementary Figs. 7 and 8). The highest mAP of 0.747 was obtained with an IoU-T of 0.1 on external dataset A whose CXRs form People’s Hospital of Banan, and this value was slightly lower than that obtained by the YOLOX model (0.769). The average precision for each external dataset was 0.659, 0.651, 0.651 and 0.588, while the average recall values were 0.624, 0.621, 0.651 and 0.643, respectively. Encouragingly, the average F1-scores achieved by the model were all over 0.60. The precision, recall and F1-scores obtained for each abnormality with different IoU-Ts on the multicentre test datasets can be found in Supplementary Tables 6-8. For different abnormalities, the AP values on different multicentre validation datasets had a certain fluctuation, which is caused by the different data distributions, but the overall generalization ability of the YOLOX model is eximious.
Furthermore, to demonstrate the accuracy of the YOLOX model in terms of localizing abnormalities, we calculated the average IoU value for each abnormality (in comparison with the GT bounding boxes annotated by the expert radiologists) on the external test dataset (a total of 10,945 CXRs from four multicentres). The average IoU values ranged from 0.458 to 0.917; more details can be found in Supplementary Table 9. It is easy to see that the YOLOX model achieved excellent performance with respect to the identification and localization of multiple abnormalities.
sales@iwildt.com
+8613720198408
