IWILDT 武汉艾崴科技有限公司
Copyright Wuhan Ai Wei Technology Co., Ltd. All Rights Reserver.
End-to-end multimodal 3D imaging and machine learning workflow for non-destructive phenotyping of grapevine trunk internal structure
Scientific Reports volume 14, Article number: 5033 (2024) Cite this article
118 Accesses
3 Altmetric
Quantifying healthy and degraded inner tissues in plants is of great interest in agronomy, for example, to assess plant health and quality and monitor physiological traits or diseases. However, detecting functional and degraded plant tissues in-vivo without harming the plant is extremely challenging. New solutions are needed in ligneous and perennial species, for which the sustainability of plantations is crucial. To tackle this challenge, we developed a novel approach based on multimodal 3D imaging and artificial intelligence-based image processing that allowed a non-destructive diagnosis of inner tissues in living plants. The method was successfully applied to the grapevine (Vitis vinifera L.). Vineyard’s sustainability is threatened by trunk diseases, while the sanitary status of vines cannot be ascertained without injuring the plants. By combining MRI and X-ray CT 3D imaging with an automatic voxel classification, we
could discriminate intact, degraded, and white rot tissues with a mean global accuracy of over 91%. Each imaging modality contribution to tissue detection was evaluated, and we identified quantitative structural and physiological markers characterizing wood degradation steps. The combined study of inner tissue distribution versus external foliar symptom history demonstrated that white rot and intact tissue contents are key-measurements in evaluating vines’ sanitary status. We finally proposed a model for an accurate trunk disease diagnosis in grapevine. This work opens new routes for precision agriculture and in-situ monitoring of tissue quality and plant health across plant species.
Wood is a complex biological structure providing physical support and serving the needs of a living plant. Its degradation by stresses or pathogens exposes the plant to huge physiological and structural changes, but the consequences might not be immediately detectable from the outside. Trunk diseases can spread internally and silently, degrading woody tissues, then erratically leading to external symptoms, production losses and, ultimately, the plant's death. While accurate detection and monitoring of wood degradation require structural and functional characterization of internal tissues, collecting such data on entire plants—nondestructively and in-vivo—is extremely challenging. As a result, the study and management of wood diseases are almost impossible in-situ. These diseases generate enormous losses on a global scale, including for sectors such as the wine industry.
Grapevine trunk diseases (GTDs) are a major cause of grapevine (Vitis vinifera L.) decline worldwide1. They are mostly undetectable until advanced stages are reached, and the European Union has banned the only effective treatment, i.e., an arsenic-based pesticide. Therefore, vineyard sustainability is jeopardized, with yearly losses of up to several billion dollars2. Detecting and monitoring GTDs is extremely difficult: fungal pathogens insidiously colonize trunks, leaving different types of irreversibly decayed tissues1. The predominant GTD, Esca dieback, erratically induces tiger stripe-like foliar symptoms, but their origin remains poorly understood3, and their sole observation is not indicative of the vines' sanitary status4,5,6,7. Quantifying degraded tissues within living vines could help determine the plant’s condition and predict disease evolution. However, classical techniques8 require sacrificing the plant and often yield limited information. Reaching a reliable diagnosis is thus impossible in
living plants.
Monitoring wood degradation using non-destructive imaging techniques has primarily been tested on detached organs, blocks, or planks, and using a single technique: Magnetic Resonance Imaging (MRI)9,10 or X-ray computed tomography (CT)11,12,13,14. In grapevine, CT scanning allowed the visualization of the graft union15, the xylem refilling16, tyloses-occluded vessels17, and the quantifying of starch in stems18. Synchrotron X-ray CT has been applied to leaves to investigate the origin of foliar symptoms related to trunk diseases, suggesting that symptoms might be elicited from the trunk3. X-ray CT and MRI were successfully combined to collect anatomical and functional information to investigate stem flow in-vivo19. These techniques were recently tested for trunk disease detection20 but were applied separately and on different wood samples, preventing the possibility of combining modalities and thus limiting their effectiveness, and failing to distinguish healthy and defective tissues using MRI.
Imaging-based plant studies are usually performed at a microscopic scale and on a specific detached tissue or organ but rarely on a whole plant. The field of investigation is limited by difficulties in adapting imaging devices to plants and in coupling signals collected from different imaging modalities, preventing the development of ‘digital twin’ models21 for plants.
Moreover, monitoring wood degradation using multimodal imaging necessitates proper registration and the identification of specific signatures for structural and physiological traits
of interest. Such signatures are not well described on wood but are mandatory to deploy automatic quantitative approaches. Experts should perform a preliminary conjoint analysis of multimodal imaging signals together with manual pixel-wise annotation of wood degradation before deploying automatic morphological phenotyping methods based on tissue segmentation and machine learning.
To address these issues, we developed an end-to-end workflow for in-vivo phenotyping of internal woody tissues condition, based on multimodal and non-destructive 3D imaging, and assisted by AI-based automatic segmentation. This approach was applied to vine imaging datasets acquired in a clinical imaging facility. 3D images were acquired in five different modalities (X-rays for structure, three MRI parameters for function, and serial sections for expertise) on entire plants, and combined by an automatic 3D registration pipeline22. Based on serial section annotations, structural and physiological signatures characterizing early- and late-stages of wood degradation were identified in each imaging modality. Then a machine-learning model was trained to automatically classify tissue condition based on the multimodal imaging data, achieving high performance in distinguishing healthy and sick tissues. We could, therefore, perform an accurate quantification of intact, degraded, and white rot compartments within entire vine trunks. We also evaluated the contribution and efficiency of each imaging technique for tissue detection. Finally, we studied the relationships between external foliar
symptom expression and the distribution of internal healthy and sick tissues.
This study highlights the potential of our 3D image- and AI-based workflow for non-destructive and in-vivo diagnosis of complex plant diseases in grapevine and other plants. It gives access to key indicators to evaluate vines’ inner sanitary status and allows structural and functional modeling of the whole plant. Plant-specific’ digital twins’21 could revolutionize agronomy by providing dedicated models for diseased plants and computerized assistance to diagnosis.
Based on foliar symptom history, symptomatic- and asymptomatic-looking vines (twelve total) were collected in 2019 from a Champagne vineyard (France) and imaged using four different modalities: X-ray CT and a combination of multiple MRI protocols: T1-, T2-, and PD-weighted (w) (Fig. 1). Following imaging acquisitions, vines were molded, sliced, and each side of the cross-sections photographed (approx. 120 pictures per plant). Experts manually annotated eighty-four random cross-sections and their corresponding images according to visual
inspection of tissue appearance. Six classes showing specific colorations were defined (Fig. 2a): (i) healthy-looking tissues showing no sign of degradation; and unhealthy-looking tissues such as (ii) black punctuations, (iii) reaction zones, (iv) dry tissues, (v) necrosis associated with GTD (incl. Esca and Eutypa dieback), and (vi) white rot (decay). The 3D data from each imaging modality—three MRIs, X-ray CT, and registered photographs—were aligned into 4D-multimodal images22. It enabled 3D voxel-wise joint exploration of the modality’s information and its comparison with empirical annotations by experts (Fig. 2b).
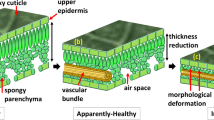
General Workflow: From multimodal vine imaging to data analysis. (1) and (2) Multimodal 3D imaging of a vine using MRI (T1-weighted, T2-w, and PD-w) and X-ray CT. (3) (Optional step) the vine is molded and then sliced every 6 mm. Pictures of cross-sections (both sides) are registered in a 3D photographic volume, and experts manually annotate some cross-sections. (4) Multimodal registration of the MRI, X-ray CT, and photographic data into a coherent 4D image using Fijiyama22. (5) Machine-learning-based voxel classification. Segmentation of images based on the tissue expert manual annotations: wood (intact, degraded, white rot), bark, and background. The classifier was trained and evaluated using manual annotations collected on different vines during Step 3. (6) Data analysis and visualization.
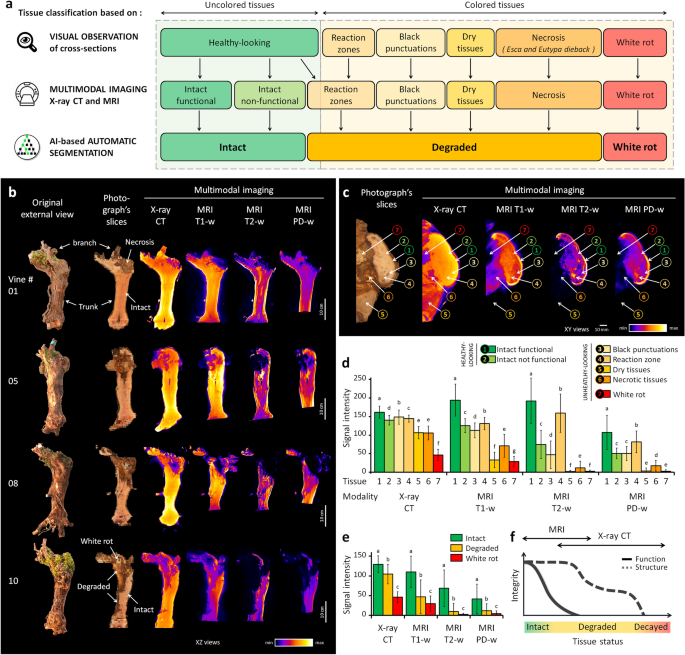
Multimodal imaging and signal analysis. (a) Correspondences between tissue categorization based either on visual observation of trunk cross-sections (6 classes), multimodal imaging data (7 classes), or AI-based segmentation (3 classes). (b) Multimodal imaging data collected on vines. XZ views of the photographic, X-ray CT, and MRI volumes, after registration using Fijiyama22. (c) Example of manual tissue annotation and corresponding multimodal signals. (d) Multimodal signal statistics estimated from random trunk cross-sections. (e) Multimodal signal values collected automatically on all 4D datasets (46.2 million voxels total) after AI-based voxel classification in three main tissue classes defined as intact, degraded, or white rot. (f) General trends for functional and structural properties during the wood degradation process, and proposed fields of application for MRI and X-ray CT imaging. Legend: letters on bar plots correspond to Tukey tests for comparing tissue classes in each modality.
A preliminary study of manually annotated random cross-sections led to the identification of general signal trends distinguishing healthy- and unhealthy-looking tissues (Fig. 2a,c,d). In healthy-looking wood, areas of functional tissues were associated with high X-ray absorbance and high MRI values, i.e., high NMR signals in T1-, T2-, and PD-weighted images, while nonfunctional wood showed slightly lower X-ray absorbance (approx. − 10%) and lower values in all three MRI modalities (− 30 to − 60%).
In unhealthy-looking tissues, signals were highly variable. Dry tissues, resulting from wounds inflicted during seasonal pruning, exhibited medium X-ray absorbance and very low MRI
values in all three modalities. Necrotic tissues, corresponding to different types of GTD necrosis, showed medium X-ray absorbance (approx. − 30% compared to functional tissues) and medium to low values in T1-w images, while signals in T2-w and PD-w were close to zero (− 60 to − 85%). Black punctuations, known as clogged vessels, generally colonized by the fungal pathogen Phaeomoniella chlamydospora, were characterized by high X-ray absorbance, medium values in T1-w, and variable values in T2-w and PD-
w. Finally, white rot, the most advanced stage of degradation, exhibited significantly lower mean values in X-ray absorbance (− 70% compared to functional tissues; − 50% compared to necrotic ones) and in MRI modalities (− 70 to − 98%).
Interestingly, some regions of healthy-looking, uncolored tissues showed a particularly strong hypersignal in T2-w compared to the surrounding ones (Fig. 2d). Located in the vicinity of necrotic tissue boundaries and sometimes undetectable by visual inspection of the wood, these regions likely corresponded to the reaction zones described earlier, where host and pathogens strongly interact and show specific MRI signatures23.
These results highlighted the benefits of multimodal imaging in distinguishing different tissues for their degree of degradation, and in characterizing signatures of the degradation process. The loss of function was correctly highlighted by a significant MRI hyposignal. The necrosis-to-decay transition was marked by a strong degradation of the tissue structure and a loss of density revealed by a reduction in X-ray absorbance. While distinguishing different types of necrosis remained challenging because their signal distributions overlap, degraded tissues exhibited multimodal signatures permitting their detection. Interestingly, specific events such as reaction zones were detected by combining X-ray and T2-w modalities. Overall, MRI appeared to be better suited for assessing functionality and investigating physiological phenomena occurring at the onset of wood degradation when the wood still appeared healthy (Fig. 2f). In contrast, X-ray CT seemed more suited for discriminating more advanced stages of degradation.
To propose a proper in-vivo GTD diagnosis method, we aimed to assess vine condition by automatically and nondestructively quantifying the trunks' healthy and unhealthy inner compartments in 3D. To achieve this complex task, we trained a segmentation model to detect the level of degradation voxel-wise, using imaging data acquired with non-destructive devices. In light of our initial observations and the identified ambiguities at the pixel level in small areas, we established a three-class categorization of tissue degradation: (1) ‘intact’ for functional or nonfunctional but healthy tissues; (2) ‘degraded’ for necrotic and other altered tissues; and (3) ‘white rot’ for decayed wood (Fig. 2a). This streamlined categorization is more
straightforward for high-throughput expert labeling pixel-wise while providing sufficient detail to effectively characterize different levels of tissue degradation.
An algorithm was trained to automatically classify each voxel in one of the three classes based on its T1-w, T2-w, PD-w, and X-ray absorbance values (Fig. 3a). The classification was performed using the Fast Random Forest algorithm implemented in the Weka library24. The algorithm was first trained on a set of 81,454 manually annotated voxels (Table S1), then cross-validated, and finally applied to whole 4D-images (46.2 million voxels total) (Fig. 1, step 4). The validation process was conducted across 66 folds. In each fold, we trained the model on ten specimens and validated it on the annotated voxels from the remaining two specimens in the test set. The results from all folds were aggregated into a global confusion matrix, which was instrumental in identifying the primary sources of classification errors. The mean global accuracy of the classifier (91.6 ± 2.0%) indicated a high recognition rate, with minor variations among cross-validation folds (Table S2). The lowest performance (82.0%) occurred when testing specimens 3 and 4 after training on the others, and was the only instance of accuracy falling below 89%. The performance of other folds within the same category closely aligns with those in different-category folds, showcasing robustness across various validation conditions in the 66 cross-validation folds. In our evaluation, F1 scores were 93.6 ± 3.7% for intact, 90.0 ± 3.8% for degraded, and 91.4 ± 6.8% for white rot tissue classes. The great majority of incorrect classifications were either due to confusion between intact and degraded classes (53.4%) or between degraded and white rot (20.8%) (Table S3). Intact and white rot classes were seldom confused (< 0.001% error).
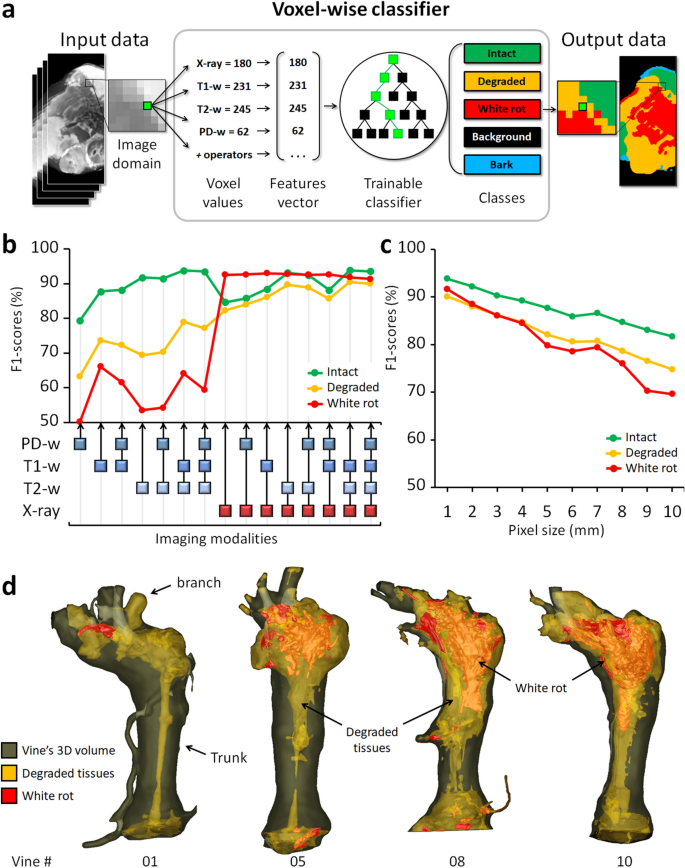
Automatic tissues segmentation. (a) AI-based image segmentation using multimodal signals. (b) Comparison of all possible imaging modality combinations for their effectiveness (F1-scores) in tissue detection. (c) Effectiveness of tissue detection at lower imaging resolutions (using four modalities). (d) 3D reconstructions highlighting the extent and localization of the degraded and white rot compartments in four vines.
The same validation protocol was used to compare the effectiveness of all possible combinations of imaging modalities for tissue detection (Fig. 3b): the most efficient combination was [T1-w, T2-w, X- ray] for detection of intact (F1 = 93.9 ± 3.4%) and degraded tissues (90.5 ± 3.2%); and [T1-w, X-ray] for white rot (93.0 ± 5.1%). Interestingly, the X-ray modality alone reached almost similar scores for white rot detection. In general, slightly better results (± 0.5%) were obtained without considering the PD-w modality, likely due to its lower initial resolution.
The classifier was finally applied to the whole dataset. Under the assumption of the proper generalization of our model, we utilized all available data, including computations on non-ground truth pixels during inference, to compute robust statistics and compare tissue contents in different vines. Considering the entire classified dataset (46.2 million voxels), mean signal values significantly declined between intact and degraded tissues (− 19.3% for X-ray absorbance; and − 57.3%, − 86.3% and − 71.3% for MRI T1-w, T2-w, and PD-w, respectively); and between degraded and white rot (− 56.0% for X-ray absorbance; and − 36.8%, − 76.8% and − 64.2% for MRI T1-w, T2-w, and PD-w, respectively) (Fig. 2e and Table S4).
With the increasing deployment of X-ray and NMR devices on phenotyping tasks, in-field imaging has become accessible, but at a heavy cost in terms of image quality and resolution. We challenged our method by training and evaluating the classifier at coarser resolutions, ranging from 0.7 to 10 mm per voxel (Fig. 3c). Results proved our approach maintained correct performances even at 10 mm (F1 ≥ 80% for intact; ≥ 70% for degraded and white rot), while a human operator can no longer recognize any anatomical structure or tissue class at this resolution.
These results confirmed the wide range of potential applications and the complementarity of the four imaging modalities. Combining medical imaging techniques and an AI-based classifier, it was possible to segment intact, degraded, and white rot compartments automatically and nondestructively inside the wood. This represents an important breakthrough in their visualization, volume quantification and localization in the entire 3D volume of the vines (Fig. 3d).
Non-destructive detection of GTDs in vineyards is currently only possible through observing foliar symptoms and vine mortality. Numerous studies are based on these proxies for phenotyping. Foliage is usually screened at specific periods of the year when Esca or Eutypa dieback symptoms occur, and this screening is usually repeated for one or several years. However, new leaves are produced each year, and symptoms may not recur in following years, making any diagnosis hazardous at best, and attempts to correlate external and internal impacts of GTDs unsuccessful. Here, foliar symptoms were recorded yearly for twenty years since the plot was planted in 1999 (Fig. 4a). Together with the accurate quantification and localization of degraded and non-degraded compartments in trunks, this allowed more advanced investigations.
sales@iwildt.com
+8613720198408
