IWILDT 武汉艾崴科技有限公司
Copyright Wuhan Ai Wei Technology Co., Ltd. All Rights Reserver.
Home > News > Industry News
Ultracompact mirror device for forming 20-nm achromatic soft-X-ray focus toward multimodal and multicolor nanoanalyses
Chromatic aberration, which appears as color fringing due to a shift of focus with wavelength, is an intrinsic property of light focusing. Such stretched foci impair high-resolution imaging using polychromatic or broadband light sources. Visible-light microscopes and telescopes overcome this physics barrier by employing achromatic doublet lenses or Newtonian and Cassegrain reflectors, which date back to the 17th and 18th centuries1,2.
Bright monochromatic X-rays in the soft-X-ray region (low-energy range of 0.3 to 2 keV) have been generated using synchrotron radiation (SR), allowing soft-X-ray microscopy to use diffractive focusing devices. Despite their inherent chromatic aberration, such devices can focus SR-based monochromatic soft X-rays to a sub-10-nm spot size3. However, chromatic aberration causes a dependence of the focus position on the X-ray wavelength (photon energy). Energy scanning thus requires samples to be repositioned throughout or between the spectroscopy procedures. Chromatic aberration also imposes monochromaticity on photon-hungry methods that can use polychromatic X-rays. Soft-X-ray fluorescence microscopy, for instance, increases the fluorescence count by expanding the irradiated sample area to the sub-micrometer level4,5 or extending the measurement time6 rather than by enhancing the photon flux using polychromatic or broadband energy nanoprobes. These drawbacks of diffractive focusing devices hinder multimodal and multi-energy soft-X-ray nanoanalyses even though the structural7, chemical8, elemental9, and magnetic10 composition of samples can be determined in the soft-X-ray region. As is the case for the visible-light regime, achromatic focusing devices are essential for advancing nanoscale soft-X-ray microscopy beyond the limit of chromatic aberration.
As achromatic lenses significantly absorb soft X-rays11, solely reflective devices are practical for achromatic soft-X-ray nanoprobes. Soft-X-ray nanofocusing requires a ten to twenty times larger numerical aperture (NA) than that for nanofocusing in the hard-X-ray region (high-energy range of >10 keV). A large NA necessitates increasing the grazing angle of X-ray mirrors, for instance from 1 to 25 mrad, which makes the focusing wavefront susceptible to surface figure errors (see Methods for θ0). Nanoscale fabrication technologies have been developed to smooth traditional hard-X-ray focusing mirrors12,13 and to precisely form large-NA X-ray mirrors14,15,16. Nevertheless, rigorous fabrication requirements have prevented advanced X-ray mirrors from achieving the ideal soft-X-ray focus size15,16,17,18,19,20. Achromatic soft-X-ray nanofocusing is barely diffraction-limited with a focus size of 241 nm × 81 nm at 0.3-keV photon energy18. The focus size does not shrink, but instead expands, with shortening X-ray wavelength19,20 because both the diffraction limit and the wavefront error tolerance for the diffraction limit are proportional to the X-ray wavelength1. Currently available achromatic soft-X-ray nanoprobes are severely limited by the fabrication process used.
To realize ideal nanofocusing over the entire soft-X-ray range, novel strategies have to be adopted in addition to conventional straightforward development. Due to the grazing angle limitation in the hard-X-ray region, X-ray mirrors have been extended to 1 m for large spatial acceptance while maintaining nanoprecision21,22. With the large grazing angle allowed in the soft-X-ray region, millimeter-scale mirrors moderately accept X-rays and achieve focusing throughput superior or comparable to that for diffractive focusing devices3,8. Such mirrors can be precisely fabricated because only the middle- to high-frequency range (1 cm−1 to 10 μm−1) is crucial for their smooth and freeform shapes (low-frequency figure errors on millimeter-scale mirrors are considered to be linear offsets). X-ray mirrors have been
designed with long focal lengths (>100 mm) for diverse detector-sample arrangements23. In contrast, short mirrors can bring their foci much closer to the mirror center. Millimeter-scale focal lengths enhance focusing robustness as X-rays reach the focal plane before widely spreading due to mirror figure errors (see Methods).
Such ultracompact mirrors can be simple alternatives for ideal nanofocusing. Nevertheless, their fabrication is even more challenging than that of conventional mirrors, as short focal lengths proportionally decrease the tangential radii of curvature (ROCs), making existing fabrication techniques less effective. A robust focusing strategy, reinforced by new technology, should enable the realization of ideal achromatic soft-X-ray nanoprobes.
Here, besides developing fabrication techniques for highly curved mirrors, we examine remarkably compact mirrors and short focal lengths for nanofocusing soft X-rays. The proposed mirror system employs a sequentially crossed arrangement referred to as theKirkpatrick-Baez (KB) geometry24 (see below), which simplifies the shape of the individual mirrors. An ultracompact KB (ucKB) mirror with component focal lengths of 2 and 8 mm is designed based on a short-focal-length strategy and then fabricated using our advanced methods. The ucKB mirror achieves a sub-50-nm nanoprobe with a photon energy of more than 1 keV, which gives access to mesoscopic scales below 100 nm, where magnetic skyrmions10 and subcellular biological behavior25 between bulk and nanoscale properties emerge. We apply the ucKB mirror to enhance soft-X-ray fluorescence microscopy, namely the low-energy X-ray fluorescence (LEXRF) technique26. The results of observations of fixed biological specimens demonstrate the feasibility of a multimodal and multicolor soft-X-ray nanoanalysis.
Figure errors cause an uneven slope distribution, which scatters rays in proportion to the focal length. From a geometrical viewpoint, short focal lengths mitigate the effects of mirror defects on ray deflection (see Methods). The focus spot diffracted by figure errors is deduced using wave optics:
$$\Delta u\approx \frac{\lambda r}{{d}_{{{{{{{{\rm{m}}}}}}}}}{\theta }_{{{{{{{{\rm{0}}}}}}}}}}\,,$$where Δu is the gap between the diffracted focus spots, λ is the wavelength of the monochromatic X-rays, r is the distance between the focus and the downstream mirror end, dm is the spatial wavelength of a periodic figure error, and θ0 is the grazing angle of X-ray mirrors (see Methods). In principle, foci close to the devices are beneficial for realistic nanofocusing systems. Equation (1) with empirical values shows that soft-X-ray nanofocusing mirrors for mesoscopic scales require r = 1 mm (see Methods). Diffractive nanofocusing devices often employ an r value of tens to hundreds of micrometers3. However, an r value of 1 mm goes against the traditional design philosophy for hard-X-ray mirrors.
As illustrated in Fig. 1a, the KB geometry simplifies a doubly curved focusing mirror to a pair of elliptic-cylindrical surfaces, namely a vertically focusing mirror (VFM) and a horizontallyfocusing mirror (HFM). However, one mirror comes between the other mirror and the focus, and the downstream mirror prevents a short upstream focal length. To achieve an extremely short focal length for both mirrors of the ucKB mirror, the downstream mirror length was reduced to 2 mm. Table 1 lists the detailed optical design parameters for the VFM and HFM. The r value for the VFM is 1 mm. The ucKB mirror was designed to concentrate 1-keV soft X-rays into a sub-50-nm focus spot, which is sufficient for mesoscopic-scale analyses. Fig. 1: Experimental configuration using ultracompact Kirkpatrick-Baez (ucKB) mirror composed of vertically focusing mirror (VFM) and horizontally focusing mirror (HFM). 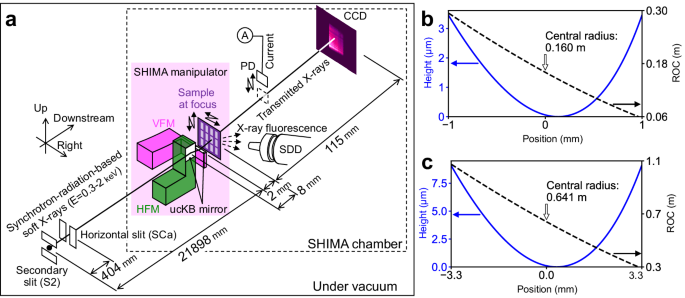
a Layout of soft-X-ray microscope. The transmitted X-rays and diffraction patterns are acquired with a charge-coupled device (CCD) X-ray camera. Low-energy X-ray fluorescence microscopy simultaneously utilizes a silicon drift detector (SDD) and a photodiode (PD) to capture X-ray fluorescence and absorption, respectively. Designed elliptic figure profiles and sub-meter radii of curvature (ROCs) of (b) VFM and (c) HFM. With the positional origin at the mirror center, the positive x-direction is toward the downstream side of the mirror.
The large NA and demagnification factor require a sub-meter-radius design, as shown in Fig. 1b and c. Such strongly curved mirrors are the most critical challenge in terms of advanced production and metrology.
We developed a figure correction method with a sub-millimeter spatial resolution and simple interferometry, both of which were specifically designed for millimeter-long sub-meter-radius mirrors. This combination overcomes the technical obstacles, allowing the production of the first pair of sub-meter-radius mirrors, as shown in Fig. 2a.
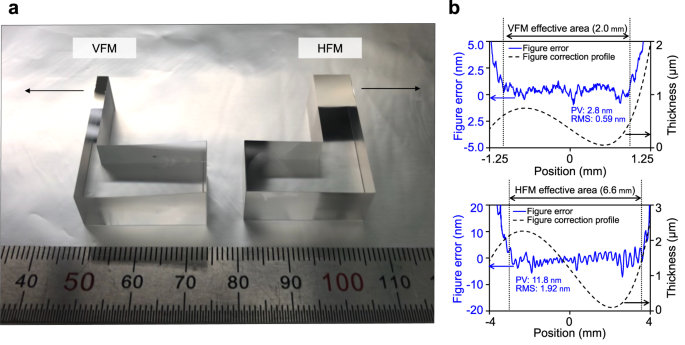
a Elliptic cylindrical reflective surfaces fabricated on L-shaped glass cylinder substrates (ruler units: mm). Arrows indicate X-ray path. b Film thickness profile for figure correction of substrates (dotted line) and residual figure errors (solid line). The effective area reflected soft X-rays in the experiments. Figure errors within this area are given in terms of peak-to-valley (PV) and root-mean-square (RMS) values. With the positional origin at the substrate center, the positive x-direction is toward the downstream side of the mirror.
Angstrom-scale smooth cylindrical surfaces were efficiently transformed into the designed elliptic-cylindrical reflective surfaces through Ni deposition. Figures 2b and c show that the residual figure errors were controlled to within 0.5% of the maximum Ni film thickness, which can reach several micrometers. Compared to the traditional differential deposition technique27, the present figure correction achieves a higher aspect ratio (length to height) for the VFM film thickness profile (50000:1 vs. 1000:1). Rayleigh’s quarter wavelength rule is an empirical criterion for an ideal wavefront at the focus1. Considering this rule and the peak-to-valley (PV) residual errors (2.8 and 11.8 nm for the VFM and HFM, respectively), the VFM can ideally focus soft X-rays below 2-keV photon energy. See Methods for details of the developed production and measurement process.
The ucKB mirror was evaluated at beamline BL25SU-A, SPring-8, Japan, with a photon-energy tunability from 0.3 to 2 keV28. The ucKB mirror was mounted in the soft-X-ray high-resolution mapping (SHIMA) system, which is detailed in Methods.
As shown in Fig. 3a, the focus position formed by the ucKB mirror stays mostly constant over different photon energies. The nanobeam shrinks with increasing photon energy. The difference in focus size between ptychography and knife-edge scanning is due to the blunt knife edge. Nevertheless, knife-edge scanning at 1-keV photon energy has a focus size of 77.4 nm × 96.7 nm in terms of the full width at half maximum (FWHM). The large figure error for the HFM causes the horizontal focus size to not reach the design value at 2-keV photon energy. The ptychographic focus size generally falls in the design value range. As shown in
Fig. 3b, the ptychographically reconstructed profiles exhibit subtle sidelobes at 2-keV photon energy; however, the nanobeam is focused to a spot size of 20.4 nm × 40.7 nm. The large NA for the ucKB mirror allows its vertical focus size to reach the minimum size that total-reflection mirrors can practically attain in the hard-X-ray region (25 nm)29. The ratio of the flux within the rectangular FWHM focus area was over 40% at a photon energy of 1 keV or less. See Methods and Supplementary Section 3 for details of the focusing performance.
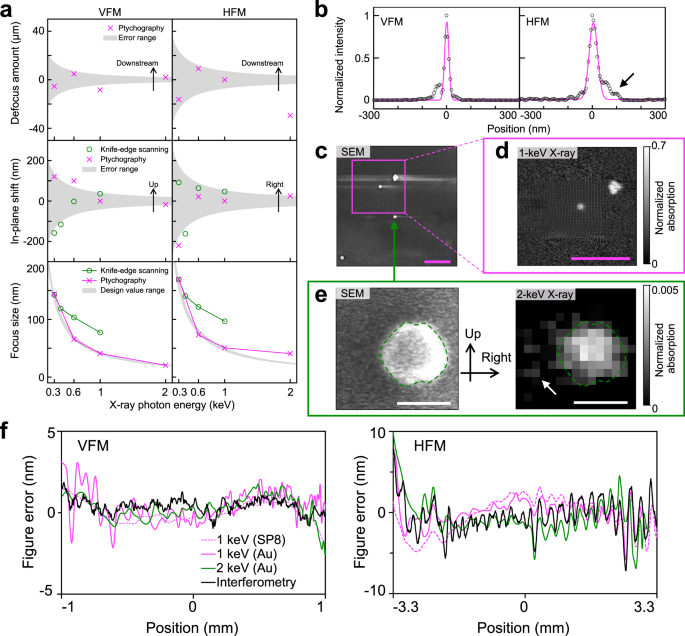
a Focus position and full width at half maximum (FWHM) focus size versus X-ray photon energy. The error ranges for the defocus amount and the in-plane shift were calculated based on the ± Rayleigh range and ± FWHM focus size, respectively. The knife-edge scanning and ptychography methods both reveal that the increased photon energy condensed soft X-rays into a smaller focus spot. b Ptychographically reconstructed focusing profiles with an FWHM spot size of 20.4 nm × 40.7 nm at 2-keV photon energy. c Scanning electron microscopy (SEM) and (d) ptychography images of Au nanoparticles. The ptychography image was captured at 1-keV photon energy with a 10.3-nm pixel size. The Au particles were mounted on a silicon nitride supporting film. The weak electric conductivity of this film causes charge-up effects, which manifest as a streak in the SEM image. Scale bars in (c) and (d) 1 μm. e SEM micrograph and 2-keV scanning transmission X-ray microscopy (STXM) image of single Au nanoparticle. The bright area differs in the images as SEM detects electron scattering from the surface and STXM measures the transmittance. The dashed lines highlight the outline of the nanoparticle. The sidelobe in (b) causes satellite signals (see arrows). Scale bar: 100 nm. The X-ray images in (d, e) were captured at the identical focus position. The positive coordinates follow the directions in Fig. 1. f Comparison of figure errors converted from ptychographic probe functions and observed using interferometry. The specimens given in parentheses are described in Methods. With the positional origin at the mirror center, the positive x-direction is toward the downstream side of the mirror.
To verify the formation of this achromatic nanoprobe, Au nanoparticles were observed, as shown in Fig. 3c. After the ptychography image in Fig. 3d was used to locate four condensed particles at 1-keV photon energy, scanning transmission X-ray microscopy (STXM) was performed at 2 keV with a 15-nm scanning pitch. Figure 3e compares the particle observed by scanning electron microscopy (SEM) and STXM. The elongated X-ray nanoprobe results in a lower horizontal resolution in the STXM image. The right sidelobe in the horizontal focusing profile in Fig. 3b grazed the particle, resulting in satellite signals on the left-hand side of the image (see arrows). Nevertheless, the boundary of the particle is sharp vertically; the STXM image shows even small bump outlines at the top and bottom of the particle.
The figure errors for the VFM and HFM were determined based on the ptychography results, as shown in Fig. 3f. The interferometry and ptychography results agree within 3 nm, showing that the wavefields were successfully reconstructed. The root-mean-square surface roughness in a 500-nm square area of the mirror was 0.43 nm, which is small enough to prevent X-ray scattering. It is thus concluded that the focus size was precisely evaluated using ptychography and that the ucKB mirror can concentrate X-rays into sub-50-nm spots. See Methods and Supplementary Section 2 for details of the preparation of test specimens and reconstructed figure errors, respectively.
As the focus position is constant, the ucKB mirror can achromatically nanofocus a series of soft X-rays whose photon energy varies even by as much as a factor of two, as shown in Fig. 4a. Such multicolor nanoprobes enhance the LEXRF technique26, which suffers from low fluorescence yields for light elements30. Higher-energy X-rays can stimulate fluorescence
from a wider range of chemical elements. However, fluorescence emission events for light elements such as C, N, and O are typically 5 and 30 times more sporadic at 1 and 2 keV, respectively, than those for metals. With the incident photon energy tuned to 1 keV, a sub-100-nm bicolor nanoprobe composed of 1-keV fundamental X-rays and 2-keV harmonics was produced using the ucKB mirror to stimulate fluorescence from both light elements and metal elements. To demonstrate the effectiveness of the LEXRF technique with a bicolor nanoprobe, Hep G2 cells and primary hippocampal neurons were chemically fixed and specimens were prepared, as shown in Fig. 4b and c, respectively.
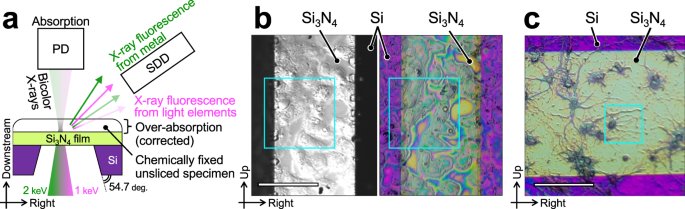
a Schematic top view of specimens and silicon nitride supporting film window in forward-scattering configuration. The bicolor X-ray nanoprobe is generated by the ucKB mirror. The lower-energy X-rays induce fluorescence from light elements, whereas the higher-energy X-rays induce fluorescence from metals. X-ray fluorescence from the specimens enters the silicon drift detector (SDD). The intensity of the transmitted X-rays is concurrently recorded with the photodiode (PD). Visible-light micrographs of (b) Hep G2 and (c) primary hippocampal neurons. The monochrome image was captured using differential interference contrast microscopy. The boxed insets show the area observed using X-rays. Scale bar: 100 μm.
Correlating the element distribution with morphology requires the sample thickness to be known. The sample thickness should be independently obtained using a technique such as atomic force microscopy31 because the X-ray absorption results represent the product of the mass absorption coefficient, density, and thickness. The iterative algorithm proposed in the present study (see Methods) can evaluate these parameters separately using solely X-ray-based results.
Figure 5a–d show X-ray absorption and fluorescence images of Hep G2 cells. The distributions of C, N, and O, which constitute proteins, agree with the overall morphology. Zn is spread over the cells and concentrated around the nuclei. The 1.739-keV fluorescence from Si increases at the window frame, demonstrating the successful production of a bicolor X-ray probe. Figure 5d shows biologically produced granules within a field of view (FOV) of 5 μm. Without sectioning the sample, our LEXRF technique revealed that the granules were hollow and surrounded by light elements. Such observations are possible only with nanoscale LEXRF microscopy.Fig. 5: X-ray fluorescence and absorption for Hep G2 cells detected by low-energy X-ray fluorescence technique. 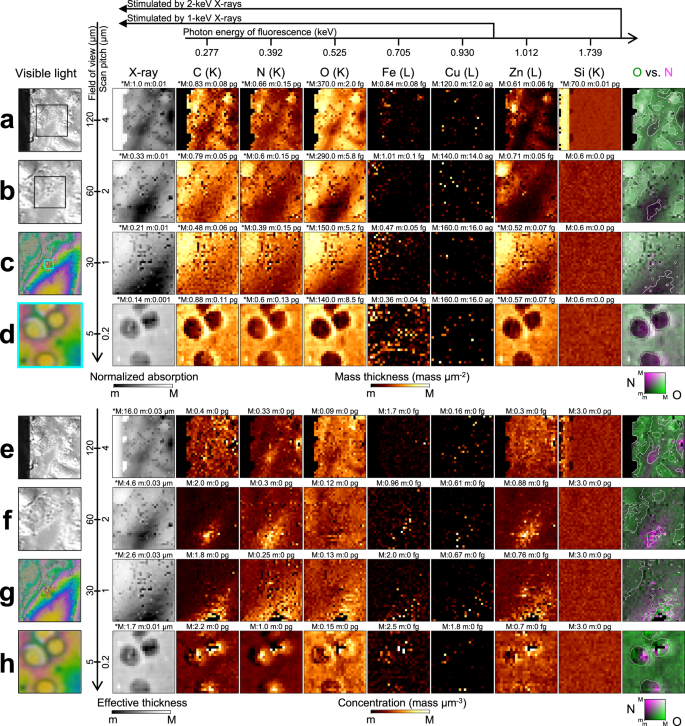
a–d Annotated visible-light micrographs, X-ray absorption images, and X-ray fluorescence images. The boxed inset in the visible-light image shows the field of view adopted in the following close-up image. The fluorescence images are in units of mass thickness (mass μm−2). The black area in the visible-light image in (a) corresponds to the Si window frame, which is almost opaque to X-rays. Cell culturing remnants are attached to the Si frame at the back of the supporting film. They appear as structures projecting from the window frame, significantly reducing the incident X-ray intensity. e–h Plain visible-light micrographs, effective thickness, and X-ray fluorescence images for the same area as that shown in (a–d). The fluorescence images are in units of mass concentration (mass μm−3). The maximum (M) and minimum (m) values for the range are given above each image and the asterisk (*) indicates a logarithmic scale. The electron shell whose vacancy is filled for fluorescence is given in parentheses next to each chemical element. Monochrome visible-light images were captured using the differential interference contrast microscope whereas color ones were observed with the digital microscope.
The sample thickness was calculated using mass information and X-ray absorption. For the area with more than 1% X-ray transmittance in Fig. 5a, the angle between the Si window frame and the supporting film is in good agreement with the theoretical value (54.0 degrees vs. 54.7 degrees, see Fig. 4a). The noise level for X-ray absorption is lower than that for fluorescence (0.1% vs. 10%). The precisely calculated thickness can be combined with the mass thickness to obtain concentration information, as shown in Fig. 5e–h. The oxygen is concentrated in the vicinity of the nucleus in Fig. 5e and f. In Fig. 5h, the O concentration and is more homogeneous than the C and N concentrations, which increase in areas with a small sample thickness.
Figure 6a–c show the mass thickness for the neurons. Iron can be observed in part of the soma in Fig. 6a. In Fig. 6d, the thickness of the neuron is slightly lower than that estimated using visible-light microscopy (3.4 μm vs. 4.0 μm). As the X-ray intensity reflects the net thickness, the difference may have resulted from the chemical fixation and air-drying processes, which can leave sparse areas inside the cell. Regarding the neurites in Fig. 6b, c, spine-like protrusions exist around the swelling, which is called a varicosity (see arrows). These structures can be involved in synaptic activities linked to Cu and Fe32,33,34, which are localized in Fig. 6b. Varicosity emergence correlates with nearby spine loss35. Copper signals near the varicosity were thus evaluated at 100-nm resolution, as shown in Fig. 6c and f. Zinc is homogeneously distributed, in contrast to Cu and Fe. The concentration analysis shows that the bump area contains more Cu and Fe than can be explained by the thickness variation.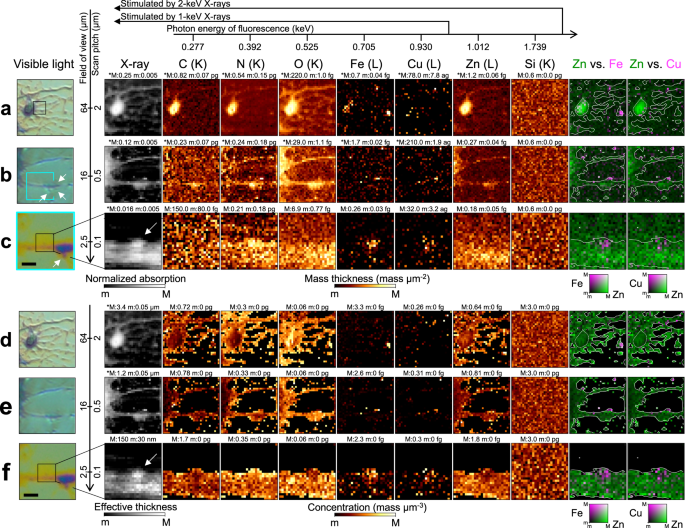
a–c Annotated visible-light micrographs, X-ray absorption images, and X-ray fluorescence images. The boxed inset in the visible-light image shows the field of view adopted in the following image. The fluorescence images are in units of mass thickness (mass μm−2). d–f Plain visible-light micrographs, effective thickness, and X-ray fluorescence images for the same area as that shown in (a–c). The fluorescence images are in units of mass concentration (mass μm−3). The arrow in the absorption image indicates a bump area in (c–f). The scale bar in (c–f) corresponds to 2 μm. The maximum (M) and minimum (m) values for the range are given above each image and the asterisk (*) indicates a logarithmic scale. The shell whose vacancy is filled with electrons for fluorescence is given in parentheses next to each chemical element.
The ucKB mirror was developed by leveraging a short-focal-length strategy and our advanced fabrication method for sub-meter-radius surfaces. The nanobeam was not fabrication-constrained but nearly diffraction-limited over the entire soft-X-ray range. A sub-50-nm achromatic focus size was attained above 1-keV photon energy. The defocus of the achromatic nanobeam was within the Rayleigh range. Considering that the beam size expands in proportion to NA and defocus distance, the ucKB mirror is a strong candidate for polychromatic soft-X-ray nanofocusing. Whereas the present study adopted a multi-energy or multimodal analysis using STXM, ptychography, and LEXRF, the achromatic nanoprobe allows X-ray absorption spectroscopy to be readily performed without adjusting the focus position following other X-ray microscopy observations, for instance to further examine the chemical states of a single aerosol nanoparticle36.
X-rays uniquely allow nanoscale chemical mapping within unsectioned and unlabeled biological samples. The Zn distribution in Fig. 5a–c and the metal locations in Fig. 6a–c are consistent with previous studies that used conventional hard-X-ray fluorescence (XRF) microscopy37,38,39,40. This nanoscale method can only map the amount of high-Z elements; X-
ray tomography41, phase contrast imaging42, and ptychography43 are used to obtain missing information about cell morphology. In contrast, the ucKB mirror, which is ideal in terms of broadband energy, focusing efficiency (ratio of focused photons to photons entering the device), and nanofocusing ability, enhances the LEXRF technique by producing a bicolor nanoprobe. It can be used to quantitatively evaluate the specimen morphology and the amount and concentration distributions of both light elements and metal elements with a lateral resolution of 100 nm. Such comprehensive information has not readily been accessible. The distributions of C, N, and O are similar in Fig. 5e–h and Fig. 6d–f. The C and N concentrations could stem from extracellular matrices or the cytoskeleton, whereas the O concentration could stem from nucleic acids. The unfilled granules in Fig. 5d and h could result from symmetric biological granules found in chemically-fixed samples44,45,46, as some labile elements such as K, Ca, and P can leach into the fixation agent47,48. Neuronal activity such as transitional spine elimination could explain the Cu and Fe concentration at the bump area shown in Fig. 6c and f35.

The present study is the first report on multicolor nanoscale X-ray fluorescence microscopy. Various chemical mapping methods are currently being studied to understand multifaceted biological phenomena49. LEXRF with an achromatic nanoprobe is expected to be a powerful subcellular mapping tool. For instance, the presented LEXRF can trace F in fluorodeoxy-D-glucose at subcellular resolution for revealing unknown glucose uptake within the brain50 or cancer cells.
Table-top broadband X-ray sources, such as attosecond lasers, might require even shorter mirrors, which are compatible with the short-focal-length strategy. An extremely short focal length requires a reduced mirror length, making the spatial wavelength of figure errors dm
close to the mirror length lm in Eq. (1). The employed fabrication method necessitates r > 0.1 mm, and thus
$$\Delta u \, \approx \, \frac{\lambda r}{{d}_{{{{{{{{\rm{m}}}}}}}}}{\theta }_{{{{{{{{\rm{0}}}}}}}}}}\approx \frac{\lambda r}{{l}_{{{{{{{{\rm{m}}}}}}}}}{\theta }_{{{{{{{{\rm{0}}}}}}}}}} > \frac{\lambda }{{\theta }_{{{{{{{{\rm{0}}}}}}}}}}\times \frac{0.1{{{{{{{\rm{mm}}}}}}}}}{{l}_{{{{{{{{\rm{m}}}}}}}}}}\,.$$λ and θ0 determine the diffraction limit. The shortest mirror length for a small focus size is 0.1 mm. Microscale XRF analyses have been conducted with table-top broadband X-ray sources51. The combination of an ucKB mirror and a table-top X-ray source could expand the use of scanning X-ray nanoanalyses, which have been restricted to SR-based X-rays

This research complies with all relevant regulations. All animal experiments were performed with the approval of the Animal Experiment Ethics Committee of the University of Tokyo and followed the University of Tokyo Guidelines for the Care and Use of Laboratory Animals.
sales@iwildt.com
+8613720198408
