IWILDT 武汉艾崴科技有限公司
Copyright Wuhan Ai Wei Technology Co., Ltd. All Rights Reserver.
The human middle ear in motion: 3D visualization and quantification using dynamic synchrotron-based X-ray imaging
The characterization of the vibrations of the middle ear ossicles during sound transmission is a focal point in clinical research. However, the small size of the structures, their micrometer-scale movement, and the deep-seated position of the middle ear within the temporal bone make these types of measurements extremely challenging. In this work, dynamic synchrotron-based X-ray phase-contrast microtomography is used on acoustically stimulated intact human ears, allowing for the three-dimensional visualization of entire human eardrums and ossicular chains in motion. A post-gating algorithm is used to temporally resolve the fast micromotions at 128 Hz, coupled with a high-throughput pipeline to process the large tomographic datasets. Seven ex-vivo fresh-frozen human temporal bones in healthy conditions are studied, and the rigid body motions of the ossicles are quantitatively delineated. Clinically relevant regions of the ossicular chain are tracked in 3D, and the amplitudes of their displacement are computed for two acoustic stimuli.


Deterioration of hearing is a significant problem in all age categories worldwide. It is estimated that by 2050 over 700 million people will have disabling hearing loss1. The middle ear is an air-filled space containing three tiny bones known as the ossicles - the malleus, the incus, and the stapes. The location of the human middle ear within the temporal bone, its size, and the amplitude of its micromotions make studying the sound transmission mechanisms extremely challenging.
The anatomy of the middle ear has traditionally been investigated with histology2,3. Although highly accurate, this technique requires sectioning of decalcified tissue and, therefore, bears the risk of structural deformation. Studies using X-ray micro-computed tomography (μCT) have overcome this issue and enabled morphological analyses on intact specimens4,5,6. The contrast and resolution of X-ray imaging could be pushed even further using a more advanced imaging technique, synchrotron-based X-ray phase-contrast microtomography. It relies on the high flux and partial coherence of a powerful synchrotron-based X-ray beam. This technique provides information about both the intensity attenuation and the phase shift of the X-ray beam passing through the sample, revealing soft tissue material that would appear uniform in conventional μCT7,8. The first investigation of middle ear structures with this technique in unstained, non-decalcified human temporal bones was published by Elfarnawany et al. (2017), who reported a good visualization of bone and soft tissues with a voxel size of around 9 μm9. More recently, Anschuetz et al. investigated the micrometric structure of the auditory ossicles at a voxel size of 0.65 μm, the highest resolution reported in the X-ray investigation of the human auditory system so far10.
In addition to morphological studies, the biomechanic investigations of the ossicles have been crucial to understanding the sound transmission mechanism in the middle ear. In 1868, Helmholtz performed one of the first experiments by manipulating the manubrium with a needle tip, and described the middle ear functions as a system of levers that rotate around a single axis. This axis is formed on one side by the anterior mallear ligament and the dorsal fibers of the lateral mallear ligament, and on the other side by the posterior incudal ligament11. In 1960, however, von Békésy demonstrated that the incudomalleolar (IM) joint could move the incus biaxially, and that the motion of the IM joint would change with frequencies at physiological sound levels: at lower frequencies of the hearing range, rotations would occur about the above-mentioned axis, while higher frequencies could trigger rotations about a second axis, perpendicular to the first through the IM joint12,13.
Velocity and displacement magnitude of the ossicles have been traditionally measured by Laser Doppler Vibrometry14,15,16. It can detect movements in the nanometer range based on the Doppler effect and, therefore, can be used on the middle ear stimulated with a broad range of frequencies between 200–10’000 Hz. However, Laser Doppler Vibrometry requires manual placement of reflective beads on the areas of interest, hindering the repeatability and reproducibility of the measurements across specimens with various sizes and shapes, and it usually provides only one-dimensional measurements. Furthermore, Laser Doppler Vibrometry requires direct sight to the ossicles, which generally includes surgical manipulations that may affect the sound transfer function, like a posterior tympanotomy, removing the vertical segment of the facial nerve, and sectioning the stapedial tendon. Chang et al. (2013) proposed a technique called optical coherence tomography vibrography to simultaneously capture the 3D shape and the sound-induced motions of the tympanic membrane and parts of the ossicular chain17,18. But only the motion parallel to the optical beam can be stimulated with this technique, and the true vibration amplitude is underestimated.
To overcome these limitations, a non-destructive 3D visualization of the middle ear motions (4D imaging) with high spatial and temporal resolutions appears helpful to study the biomechanics of the middle ear in its natural state. The TOMCAT beamline of the Swiss Light Source (SLS, PSI) has been specialized in time-resolved X-ray imaging, with the development of an ultra-fast camera that allows dynamic processes to be followed in time and three dimensions19. Recently, the beamline was able to provide an acquisition speed reaching 1000 tomograms per second while keeping a spatial resolution of a few micrometers20. With a system exhibiting a periodic movement, a retrospective gating strategy could be used to increase even further the temporal resolution up to 3 kHz21,22.
In this work, synchrotron-based X-ray phase-contrast microtomography was combined with the ultra-fast capabilities of the TOMCAT end-station to directly observe the vibrations of the intact human middle ear, tympanic membrane (TM) and ossicular chain, in response to acoustic stimulation. Micro-movements of the three ossicles, treated as rigid bodies, were resolved at 128 Hz and quantitatively delineated. Several clinically relevant anatomical points of the ossicular chain were tracked in 3D, and the amplitudes of their motions were computed for various acoustic stimuli. The findings corroborated the lever-like motions of the mallei and incudes, while revealing a more intricate stapedial behavior.
A pilot study was conducted on a first fresh-frozen human specimen (Fresh1), acoustically stimulated with a pure tone frequency of 127 Hz and with a sound pressure level of 140 dB SPL. These acoustic parameters were chosen in order to establish the first sound stimulation protocol in conditions leading to large ossicle movements, with a high sound pressure level and a frequency low in the hearing range. The dynamic microtomography of the moving sample was performed assuming a periodic vibration of the middle ear with the same period as the sound stimulation. This period was sampled into 10 time steps, each of those called a phase of movement pj. The tomography datasets were built up by acquiring a substantial number of projections over multiple and consecutive motion cycles, while the sample stage slowly rotated, and retrospectively sorting these projections back into the 10 different phases of movement (post-gating process, see Materials and Methods). After reconstruction, 3D static volumes were obtained for each phase of movement, providing a high-resolution visualization of the whole ossicular chain. In addition, phase retrieval methods applied to one dataset allowed to reveal soft tissue between the ossicles (see the incudomalleolar and incudostapedial joints in Supplementary Fig. 1.
Supplementary Movie 1 shows a radiography where the projections are post-gated into the different phases of movement: it enabled the visualization of the periodic movement of the TM without any prior 3D reconstructions. A slice in the 3D volume reconstructed at phase p0 of the movement is shown in Fig. 1a. The junction between the malleus and the TM was nicely revealed with the use of phase-contrast. The intensity profiles along a line perpendicular to the cross-section of the TM (yellow line) were extracted for each phase of movement. They are displayed as a 2D image in Fig. 1b, showing the sinusoidal displacement of the TM. The amplitude of displacement could be estimated as the shift between the two extreme positions of the TM: around 24 μm for an acoustic stimulation at 140 dB SPL. This corresponds to an amplitude of displacement within a 2D plane and at the specific location shown in Fig. 1a.
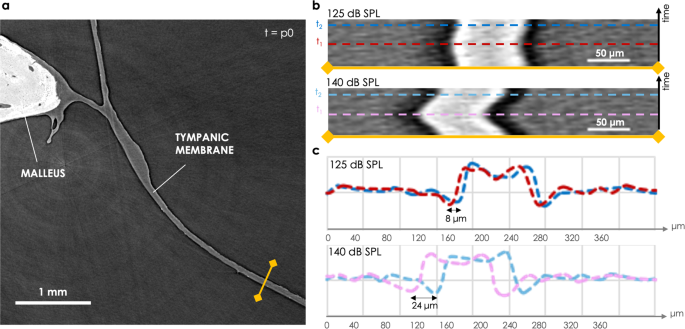
a A 2D slice is taken from the 3D volume reconstructed at phase p0 of the movement. b The intensity profile along the yellow line is displayed over time (over the 10 phases of movement), for the 2 stimulation levels, 125 dB SPL and 140 dB SPL. c The intensity profiles along the dashed lines in b (at two specific times t1 and t2 corresponding to the extreme positions of the TM) are plotted in the corresponding colors.
The ossicular motions were visualized after reconstruction of the static 3D volumes for each phase of movement. To that purpose, a 2D section through the 3D volumes was selected and compared between all phases of movement (see Supplementary Movie 2 to visualize the movement and Fig. 2b). More precisely, three sections were taken in a plane where the ossicular movement was assumed to be the largest: along the manubrium of the malleus, the long process of the incus, and the crus of the stapes (see the dashed lines in Fig. 2a). The standard deviation of the pixel gray value over the phases was plotted for every pixel of the 2D section (see Fig. 2c). It enabled the specific visualization of the moving features: the bright edges correspond to a stronger standard deviation due to the ossicular vibration over time, and their width and brightness give an indication of the amplitude of displacement, while a static feature exhibits a zero standard deviation. For example, the part of the temporal bone visible below the incus (yellow arrow in Fig. 2b) disappears completely after the standard deviation projection, confirming the absence of movement of the whole bone in comparison to the ossicles. As a proof of concept that the sound was well transmitted from the external auditory canal all the way to the inner ear, the stapes footplate movement inside the oval window - relative to the surrounding static cochlea - is shown in Supplementary Movie 3.
sales@iwildt.com
+8613720198408
